


Create Dashboards
After adding a data source, create a Dashboard to visualize the data from the data source.
A Dashboard consists of one or more panels, organized and arranged in rows. Panels display data and provide various control options.
This section briefly introduces how to create a Dashboard. For more information, see Grafana dashboards.
Steps
-
Click Dashboards in the left navigation pane of the Grafana console.
-
Click New > New Dashboard.
-
On the blank Dashboard page, click + Add visualization.
-
In the pop-up dialog, select the added data source, and the panel editing page will automatically open.
-
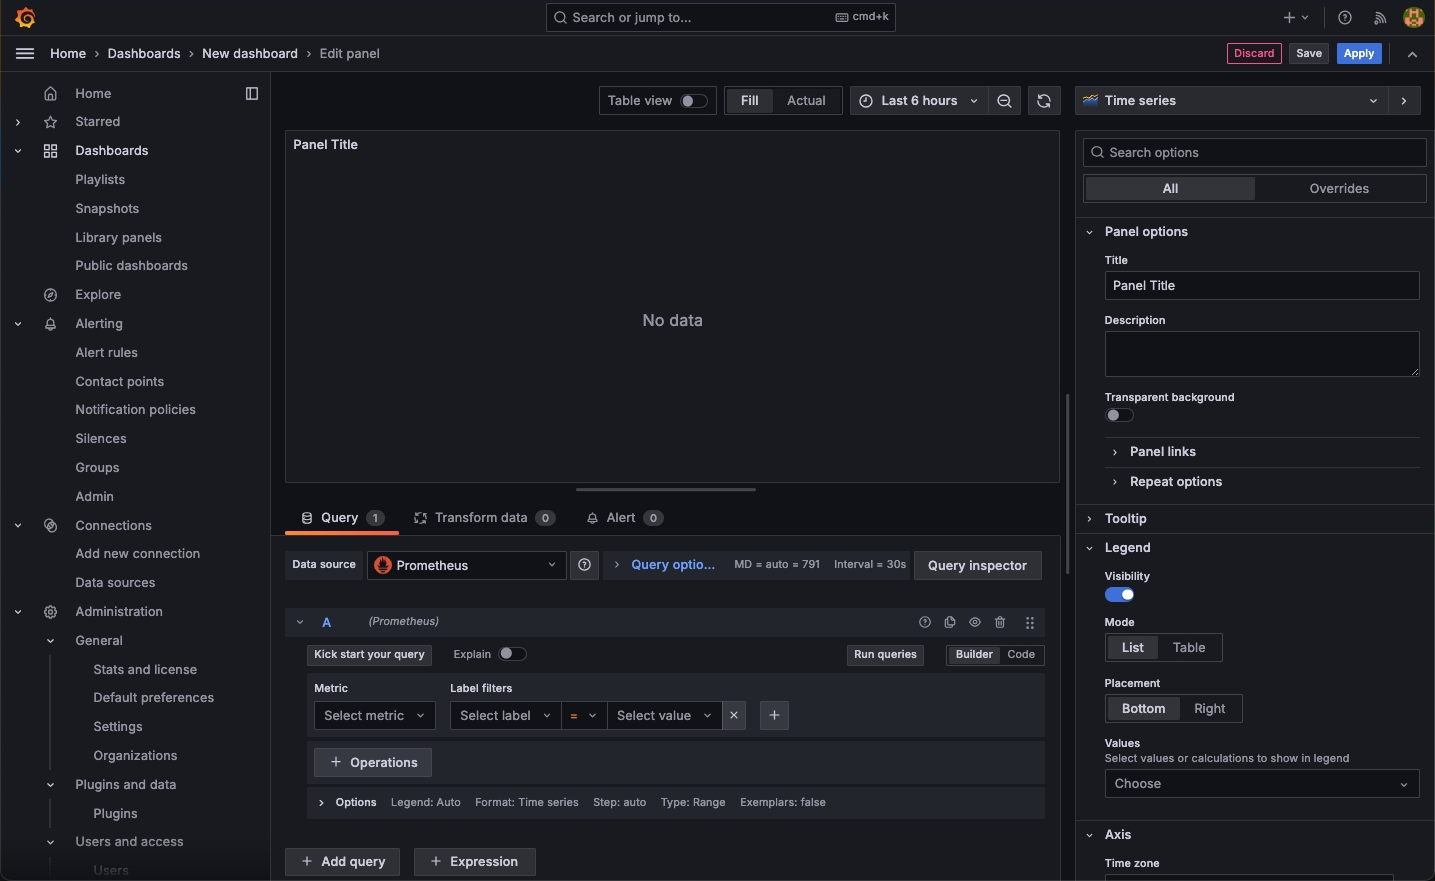
Use the data source’s query language to set the query conditions.
-
Click
 to query data.
 -
Click the chart type on the right (such as Time series) to select a chart style. The data will be displayed in this style.
-
In the Panel options area, set the panel’s name, description, etc.
-
After editing, click Apply to save the panel, and click Save to save the Dashboard.
When saving the Dashboard, you can set the Dashboard’s name, description, and directory.
-
-
On the newly created Dashboard page, click Add at the top, select Visualization, and continue to add panels.
-
After exiting the panel editing page, you can drag the panel title to move it to any position; drag the cursor at the bottom right of the panel to adjust the size of the panel in the Dashboard.
-
Click the save button at the top of the Dashboard page to save the Dashboard again.
At this point, a Dashboard with multiple panels is created.
Feedback
Was this page Helpful?
Receive the latest news, articles and updates from KubeSphere
Thanks for the feedback. If you have a specific question about how to use KubeSphere, ask it on Slack. Open an issue in the GitHub repo if you want to report a problem or suggest an improvement.
 Previous

What’s on this Page